Reports overview
What each report shows and how to filter, compare and share them.
By the end of this page you'll know which report answers which question, and how to slice any of them by date, channel, treatment, location or team member.
Finding your way around
Click or hover Reports on the left for a menu of the most-used reports you can open (in the CRM, with the Dashboard as a card on the left), each a tile with its icon: pick one to open it straight away, or choose All reports — the last tile, showing how many reports you have — for the reports page with every report. The reports page shows a band for each category — its name in the category's colour and how many reports it holds — with every report in it as a tile in that colour. A few tiles carry a short note under the title: what the report used to be called (Was Recall success) or what it adds (The full list). Hover a tile to see a one-line summary of what the report shows, and click it to open the report. A Filter reports box understands typos and synonyms ("no show" finds Attendance) and hides the categories with no match; the panel beside the rail groups reports into categories that expand to their reports, with the current report's category open.
In the clinical workspace, Reports on the rail shows the Money, Patients, Appointments, Treatment & clinical, Practice and Inventory reports, in that order, and, at a UK practice, NHS contract, with no panel beside the rail. Practitioner activity has taken Treatment completed's place there; a link or scheduled email for Treatment completed still opens it.
Every report ends with How it's counted. Click it to read exactly what the report counts: which records, on which date, and how a later correction shows.
Every report is built from the same blocks:
- Number tiles — each headline number, its line over the period and, where the report can tell, how it compares with the period before (see Comparisons).
- What changed — beside the tiles, one sentence for every number that moved, biggest change first.
- Charts — trends and breakdowns, often split by channel or another dimension, with a legend naming each colour. Hover a bar to see each part and, when the parts add up to one whole, the bar's total. Separate measures that don't add up — production beside net takings, say — stand side by side and are never totalled.
- Breakdown tables — the per-source, per-treatment or per-person detail behind the charts.
The envelope and printer icons beside the report's title schedule an email digest and print the report.
The reports
Overview
| Report | What it answers |
|---|---|
| Practice snapshot | The headline numbers in one place: new leads, conversion, treatment revenue, appointments and speed to lead — each against the previous period |
| SEO weekly digest | Local visibility, tracked search leads and value, completed SEO actions, current recommendations and retained wins |
| Ads weekly digest | Weekly ad spend and platform-reported results next to CRM truth: cost per lead and per booking, where each platform's spend and bookings go, each platform's patient journey, why leads are not proceeding, every campaign and ad group, and who booked (included on pay-as-you-go; needs the SEO & Ads add-on on the older price list) |
| Call insights weekly digest | Last week's Call AI summary and headline call numbers, as emailed every Monday (Smileline Voice, UK and US practices) — see Call insights |
Leads
| Report | What it answers |
|---|---|
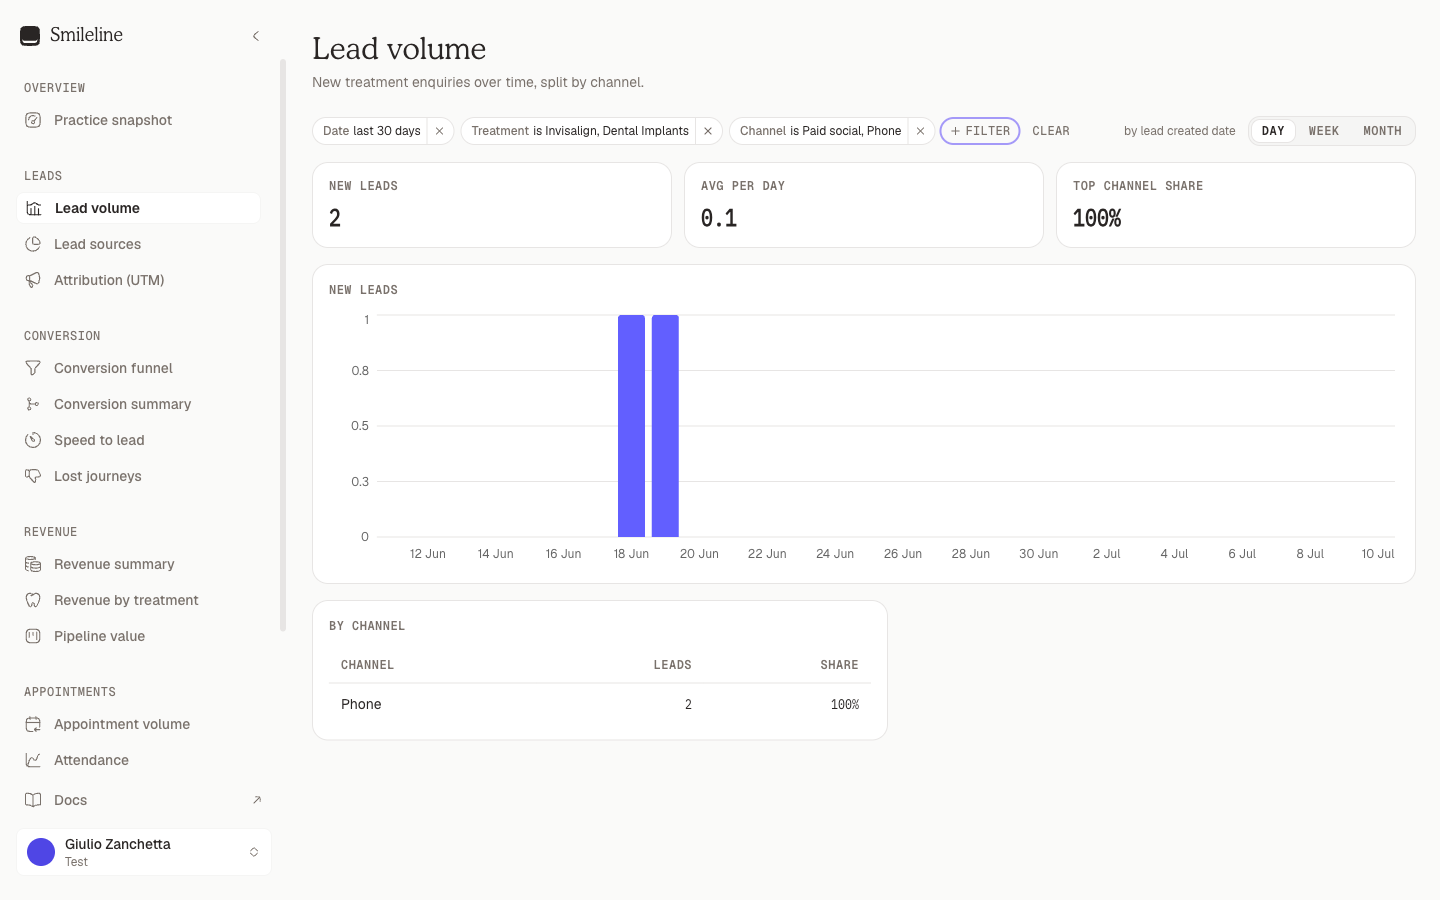
| Lead volume | New treatment enquiries over time, split by channel |
| Lead sources | Where enquiries come from: channel mix, top sources and how each source converts, then every lead in the period one by one |
| Attribution (UTM) | Marketing touches by UTM source and campaign, with the journeys, go-aheads and revenue attributed to each first touch |
| Calls | Inbound calls answered against missed, over time and by hour, ring time, the UTM source / campaign / keyword behind each call, calls per team member and the missed calls nobody rang back — see Calls |
Conversion
| Report | What it answers |
|---|---|
| Conversion funnel | How many journeys from the selected cohort reach each stage of the pipeline, stacked by channel |
| Conversion summary | Per treatment: enquiries received → contacted → booked → attended → going ahead, with conversion rates |
| Speed to lead | How fast enquiries get their first contact: averages, distribution and per-owner response times, with the leads you tried and the leads you couldn't speak to — see Speed to lead tiles |
| Not proceeding | Journeys marked not proceeding: trend, reasons and the stage they closed from, with the potential value that walked away |
| Call insights | What Call AI learned from your analysed calls: booking rates, objections, why calls didn't book and who can fix it, and for owners and managers a written summary of each week (Smileline Voice, UK and US practices) — see Call insights |
Revenue
| Report | What it answers |
|---|---|
| Revenue summary | The money taken over time, by the channel of the lead it came from, when your payments are in Smileline; otherwise the value of journeys going ahead, confirmed vs estimated, with average deal size. See Revenue on the dashboard |
| Revenue by treatment | Which treatments the revenue comes from |
| Pipeline value | The value currently sitting in the open pipeline by stage, raw and probability-weighted |
Patients
Your active patients as they stand — see Patient reports — and what they are worth over time.
| Report | What it answers |
|---|---|
| New patients per month | Who joined each month, split by payment plan, dentist or source, and who has a first visit booked, with the list of them |
| Age groups | Active patients by five-year age band and sex |
| Lapsed patients | Patients seen before but not since the start of the period |
| Birthdays | Active patients with a birthday in the period, with contact details |
| Patient value | What a patient is worth over their life, whether that value compounds, and which sources bring the valuable ones |
| Patient retention | Whether patients come back after the treatment they came for, how long they take, and who has stopped coming |
Patient value and Patient retention work differently from every other report — see Patient value and retention.
Appointments
| Report | What it answers |
|---|---|
| Appointment volume | Appointments taking place over time, by status |
| Attendance | Show rate, no-shows and cancellations — overall, over time, by appointment type and for first visits |
| Appointments | Every appointment one by one — when, patient, practitioner, reason, room, length, status and when it was booked — as Dentally's Appointments lists them |
| Appointments per month | Each practitioner's appointments and booked hours, month by month, as Dentally's Per Month charts them |
| Chair utilisation | Appointment time booked and attended against the hours each practitioner's rota makes bookable — see Money reports |
| Recalls | Every recall due in the window: booked, not booked or pre-booked, how often the patient was contacted and when they were last reminded |
| Recall effectiveness | Of the recalls that fell due each month, how many are booked or done — against a 70% goal — and the recalls that need booking now; see Recall effectiveness |
| Waiting lists | Everyone on a waiting list right now, how long they have waited, and who is past their target |
A visit moved to another time, an online booking the patient never paid the deposit for, and a visit booked by mistake are not appointments in any of these reports — not as cancellations and not in the totals. A patient who moves their visit twice and then cancels it counts one appointment, cancelled once.
Recalls
Every recall due in the window, soonest first: the patient, their last exam, the recall type, how they like to be contacted, its status, whether it was pre-booked, how many times they were contacted and when they were last reminded. The tiles count the recalls due, booked, not booked and pre-booked. The report opens on this month; widen the date filter to see further ahead. Search by patient or recall type.
If your practice is connected to Dentally, a patient Dentally holds recalls for is read from Dentally's own recalls — the status, contact method, pre-booked flag and contact count Dentally gives — so the list matches Dentally's Recalls report. If it is connected to Open Dental, a patient Open Dental holds recalls for is read from Open Dental's recalls, once a day: the recall type, due date and last exam, and a status — Booked while a recall appointment is scheduled, Skipped when the recall is switched off for the patient, otherwise Unbooked. Open Dental gives no contact method or reminder counts. Everyone else's is your Smileline recall as it stands now: Booked while the recall's visit, or any visit of the patient, is still to come, as Recall effectiveness counts it, and pre-booked when it was booked before it fell due. A completed recall has moved on to its next due date, so it shows there. A paused recall, and a patient who is archived, merged or deceased, is left out. The location and practitioner filters use the recall's own; a Dentally or Open Dental recall names neither, so filtering by either leaves those recalls out. Status narrows the list to recalls still to book (Unbooked) or Booked — Needs booking on Recall effectiveness opens it on Unbooked.
Waiting lists
A point-in-time report — the date filter does not apply. Everyone on a waiting list right now, longest waiting first: the patient, the list, its status and priority, when they were listed and days on list, the referral, target and booked dates, and the practitioner. The tiles count the entries, the average days waiting, and those past their target: the target date has passed and no appointment is booked. Search by patient or list.
If your practice is connected to Dentally, its waiting lists are read every hour: an entry Dentally no longer lists, or has archived, is off. A patient Dentally holds shows Dentally's entries only. If it is connected to Open Dental, Open Dental's ASAP list is read every hour as the list As soon as possible: an appointment no longer on it is off, and a patient Open Dental holds shows Open Dental's entries only. An entry is listed from the day its appointment was entered and shows a booked date while that appointment is scheduled; Open Dental keeps no referral or target dates. Everyone else's Smileline waitlist requests show while open or offered, or when the visit they were booked into was cancelled or missed. The From column says which.
Team
| Report | What it answers |
|---|---|
| Team activity | Outbound calls, messages and completed tasks per team member |
| Team conversion | Per owner: leads worked, contact rate, go-ahead rate and revenue from their cohort |
| Team calling | Per opener: hand-offs live and promised, hand-offs per calling hour, own bookings and hand-offs that booked; per closer: hand-offs received and booked; how long promised call-backs waited, retries that expired untried, and hand-offs by hour of day — see Team calling |
| Practitioner performance | Journeys, conversion and treatment revenue per practitioner |
Money
Every money report reads the patient ledger in the practice currency — see Money reports.
| Report | What it answers |
|---|---|
| Day sheet & takings | What was charged and taken by day, takings by payment method, refunds, discounts and write-offs, per location |
| Aged debt | What every account owes today, aged from each charge's date, plus unallocated credit |
| Income | Paid invoice items by treatment code, and payments not yet allocated — as Dentally's Income reads it for the patients it holds |
| Payment allocations | Money moved from patients' accounts to sites, practitioners and sundries, row by row; Payment allocation totals adds it up |
| Invoice timeline | Twelve months of invoices, each month split into paid and still unpaid |
| Monthly accounts | What patients owe on invoices when each month opens and closes, and the charges and payments that moved it |
| Patient accounts | Every account in debit or in credit right now, with its planned treatment — Dentally's own balance where it holds the account |
| Production | Charges raised over time by source, per practitioner and location |
| Collections | Cash in and refunds out by payment method and source, and the collection rate against production |
| Associate pay | Per practitioner: production, cash allocated to their charges, and what is still outstanding |
| Sundries | Goods sold on retail codes, by code, and manual charges one by one |
| Invoices | Invoices and credit notes issued, what's been paid in cash or settled by credit, and what's still owed; charges with no tax rate |
Treatment & clinical
Counted from the clinical record — see Clinical reports. Their rows name patients for people who can see patients, and each page of rows is recorded as a clinical read.
| Report | What it answers |
|---|---|
| Radiograph audit | UK only: the share of x-rays justified and evaluated, and the quality-grade split, by operator and type |
| Perio coverage | Probing exams, the sites assessed of those eligible, and the average bleeding and plaque scores |
| Treatment plans | Plans started in the window and how far through each is; Completed but not closed, Unbooked treatment and Unfinished treatment narrow it to the plans to act on |
| Practitioner activity | Every treatment completed, by practitioner, with its price and whether it is paid — Dentally's own for the patients it holds. It took Treatment completed's place on the hub |
| Lab turnaround | Days from sent to received and fitted, by lab |
| Prescriptions issued | Prescriptions issued, by prescriber and kind |
| New patient visits | Patients' first visits on a code ticked Counts as a new patient, by site and clinician, beside the patients registered — see New patient visits |
| Referrals | Referrals out and in by kind, recipient, referrer and status, beside the patients and charges each referrer brought |
Inventory
The stock at every site, valued at average cost — see Inventory reports. They show to people who can see both reports and inventory.
| Report | What it answers |
|---|---|
| Stock summary | Items, units and stock value right now, by room, category and tag |
| Low stock | Items out of stock or at or below their minimum level |
| Usage over time | Units and value used, over time and item by item |
| Transactions | Every take, restock, count, room move and cost change, with its source and who did it |
| Moves & transfers | Items moved from one room to another |
| Expiry | Lots expired or expiring within 30 days, with their value |
Practice
Your practice's own activity log, background exports and sign-ins, from when you began using Smileline — see Practice reports. They show to people who can see the activity log.
| Report | What it answers |
|---|---|
| Audit | Every change, export and sign-in in the activity log: what, to which item, by whom |
| Report runs | Every background export: who started it, its status and the rows written |
| User sessions | Every sign-in, sign-out and failed sign-in, by team member |
NHS (UK)
At a UK practice the clinical workspace's Reports adds an NHS card, for roles that can see both reports and NHS data. A practice in another country does not see it, and the API refuses its NHS requests.
| Report | What it answers |
|---|---|
| NHS contract | Pick a contract to see its year's UDA activity (awarded, in flight and forecast) against the target, overall and per performer — see Activity |
Filtering
The chip bar at the top of every report offers the filters that report honours — up to: Date, Board, Treatment, Channel, Lead source, Location, Owner and Practitioner. Click a chip, pick values, and the report reloads.
Things to know:
- The date window defaults to the last 30 days, in your practice's timezone. Clearing the date chip returns to that default. Patient value and Patient retention open on the last 24 months instead — they need years to say anything — and Recall effectiveness on the last 12 months.
- Each report states its date basis next to the filter bar — "by lead created date", "by close date", "by appointment date" — so you know which date the window slices on. Cohort reports follow journeys created in the window wherever they end up. A lead from a native lead form is created on the day the person submitted the form, even when it was held, retried or imported later.
- Pipeline value is point-in-time — it shows the pipeline as of now, so the date filter doesn't apply.
- Filters live in the URL. Copy the address bar to share the exact slice you're looking at; it survives reloads.
- Rows that name patients load a page at a time. In the clinical reports, Sundries, Invoices and Lead sources, the table of rows shows the newest first; click Load more for the next page until every row has shown. They show only to people who can see patients. The inventory reports' long lists load the same way, and show to everyone who can open the report.
- The inventory reports add their own filters: Room, Item, Movement, Source and Done by.
Data from Dentally
Reports that read lists only Dentally keeps for you — invoice and treatment items, recalls, account balances, waiting lists and payment allocations — say beside the filters how far that data has been read: Practice software data as of a date and time. Smileline reads the lists every hour (account balances once a day). If Dentally stops handing one over, the report keeps showing the last good read and that date stops moving. With Open Dental, the recall and waiting-list reports show the same line: its recalls are read once a day and its ASAP list every hour.
Lists
A report's list loads a page at a time; Load more fetches the next. Above it:
- Search narrows the list on every page, not only the rows already loaded, where the list offers it.
- Columns shows or hides each column. Your choice is kept in this browser, for you and this practice.
- A Total row closes a list that has one, summed over every row your filters and search keep.
Click a row to open it beside the list, with every column — hidden ones too — and Open patient when it names one.
Download CSV and print
Every table has Download CSV, and every report has a printer icon (Print) and a PDF icon (Export PDF) beside its title. All of them use the complete result for the filters you have set: a table that loads a page at a time is fetched to its last row first, with a running count of the rows fetched, and nothing is saved if a page can't be fetched. See Download CSV and Print or save as PDF.
Time grain
Reports with a timeline offer a Day | Week | Month toggle above the charts; it also sets the points of each tile's line. Weeks start on Monday. Reports without a trend chart don't show the toggle, and the two cohort reports and Recall effectiveness are always monthly — a cohort row, like a month of recalls falling due, is a calendar month by definition.
Comparisons
Number tiles compare with the period of equal length just before — a 30-day window compares to the 30 days before it. Where a tile has a comparison it shows:
- The change — up or down by a percentage, or in points for a percentage (a show rate going from 70% to 72.5% is up 2.5 pts). New means there was nothing before.
- Its colour — green when the change is good news and red when it's bad: refunds, discounts, no-shows, waiting times and costs going up are red. Numbers that are neither good nor bad, like ad spend or call volume, stay grey.
- Before — the previous period's figure and the difference in the same units.
- The previous period's line, dashed, under this period's.
What changed lists the same comparisons as sentences, biggest change first, with the dates they compare against. Choose Compare with → Off above the charts to hide every comparison and keep just the numbers; the page remembers it in its address, so a shared link opens the same way.
Some tiles have no comparison (point-in-time values and derived rates); those show the value alone, and a report with none of them doesn't offer the switch. Numbers that describe today rather than the period — what's owed now, stock on hand, the open pipeline, active and lapsed patients — have no line either, because their history isn't kept. Money reports compare whole calendar days: a 30-day window compares to the 30 calendar days before it, even across a clock change.
On the two cohort reports most tiles deliberately show no comparison, because a cohort keeps earning after you measure it and comparing a young one against an older one would always flatter the older. Patient value and retention explains which tile does compare, and why it's the only fair one.
Bookings on the dashboard
The dashboard's Bookings made tile counts the consultations booked for your leads, in Smileline or in your practice management system, on the day each one was booked, not the day the visit takes place. Its trend line, the Team leaderboard, the calendar's Insights and every report that counts bookings use the same count. Cancelled and no-show visits don't count.
Under it, All bookings (including existing patients) counts the same bookings for every patient, with or without a lead: a returning patient booked for a consultation counts there, not in Bookings made.
Each visit counts once:
- Booked on Leads — when you record They want to book a consultation on Leads, the booking is yours, on the day you recorded it. That's the same whether you picked a time in the diary, picked a visit that's already in your practice management system, or gave only the date. A visit you pick keeps the day your practice management system booked it when that was earlier, so picking a visit reception booked last week counts last week. If someone else later records a booking for the same visit, it still counts once, for whoever recorded it first. A booking Smileline sends to your practice management system for you counts once too.
- Booked in Smileline without Leads — in the calendar's diary, through online booking, by AI and automations or through the API: counted on the day the visit was created, for whoever created it.
- Booked in your practice management system — by reception, say, or by the patient on its online portal: counted on the day your practice management system says it was booked, not the day it reached Smileline.
A visit the patient booked on your practice management system's online portal (Dentally's online booking, for example) stays theirs, even when someone also records it on Leads: it still counts once. Visits imported from a file don't count, and nor does a visit your practice management system never said when it was booked.
Only consultations count as bookings. Each appointment type has a Counts as a booking switch in Settings → Visit types: turn it off for surgeries, reviews, scans and other follow-up visits, and those appointments stop counting in Bookings made, the funnel and the leaderboard, stop moving leads, and are no longer reported to Google and Meta as Booked. When you book a lead yourself on Leads, that booking always counts, whatever its appointment type. An appointment with no type counts. Changing a switch recounts past periods too.
Appointment types that come from your practice management system (Dentally's appointment reasons, for example) or from a Dentally export start with the switch on only when their name contains "consult"; Smileline's own types start on. Your choice is never overwritten by a later sync.
The leaderboard credits each booking to the team member who made it. Bookings no team member made get their own rows: Online booking, AI & automations, API, Practice system (booked there and not recorded on Leads) and Online booking (practice system) (booked by the patient on its online portal). Unknown is left for a booking nothing says anything about.
Consultations attended
Under Bookings made, Consultations attended counts the consultations in the period that the patient turned up to, by the day of the consultation. A consultation counts when its visit is arrived, in the surgery or completed, or when its attendance question was answered attended, going ahead or declined (they came and said no). Answering the question on Leads doesn't change the visit in your practice management system, so either one is enough. Each consultation counts once, even when the visit and its question both say so, and visits booked in your practice management system count too. Undoing the answer removes it.
Finalised website A/B tests keep the totals they were finalised with, and Call AI's booking rates are judged from the calls themselves, so neither changes with the Counts as a booking switch.
Bookings recorded without a diary appointment
If your diary lives in a system Smileline can't book into, you record the booking on Leads (on the web or in the mobile app) by choosing They want to book a consultation and giving the date — or no date at all. There's no appointment behind it, so the booking itself counts:
- It counts in Bookings made, the trend line and the leaderboard on the day you recorded it, credited to whoever recorded it.
- The lead counts as Booked in the funnel, the Lead → booked rate, the channel table and the lead flow.
- Undo removes it. If you book again on another date, it still counts once.
- Answering its attendance question with No, they didn't turn up or They cancelled — not coming removes it. Only that booking is removed: a patient who attended one consultation and missed a later one still counts once.
- When the appointment later reaches Smileline from your practice management system, it's the same booking: still counted once, still yours, on the day you recorded it, or the day your practice management system booked it if that was earlier. Smileline matches them when it's the patient's only consultation on that day, on that lead or on no lead. From then on, the appointment decides: if it's cancelled or the patient doesn't turn up, the booking stops counting.
- If there are two consultations that day, or the appointment is on a different day, Smileline pairs the booking with one of the patient's consultations from your practice management system that no other booking claims, on that lead or on no lead, so the two still count once. If your answer to the attendance question removes the booking, that consultation counts on its own again.
- A booking made without a lead counts in All bookings, not in Bookings made or the funnel, and not when a filter is set: filters apply through the lead.
Bookings made counts the bookings made during the period, on any lead. The funnel's Booked counts the leads that came in during the period and have booked at any time since. Neither is part of the other, so the funnel shows both above Booked: of this period's leads, booked so far, then bookings made in this period — the same number as Bookings made. For Today and This week the two windows are the same.
The ads reports — the Ads Overview, including its All campaigns and By location views, and the Ads weekly digest — count these bookings too.
Contacted by and the leaderboard
The lead flow's Contacted by column shows the first team member who worked each lead. Calls, texts, emails and outcomes recorded on Leads all count, whether or not the patient answered. A person always takes priority over an automated message. If a lead has only been contacted automatically, it shows under Automation (sequences and campaigns) or AI. Not contacted yet means nobody and nothing has reached out. This isn't the same as the dashboard funnel's Leads we spoke to step, which only counts leads someone actually got through to.
In the Team leaderboard, Leads worked counts people, not attempts: three calls and an outcome for the same patient count as one lead. It counts everyone a team member reached out to during the period, whether or not they answered and whenever their lead came in. The dashboard funnel shows the same people beside Leads we spoke to, as leads we tried to contact, counting someone once even when two team members worked them. Leads we spoke to only counts leads that came in during the period and that someone got through to, so the two numbers can differ. The percentage is the share of those leads who booked after that team member first contacted them, so it never goes above 100%. Booked counts the bookings each person made. The leaderboard always covers the whole practice, even when you filter the dashboard.
Under a team member with bookings, Booked from this period's leads counts the bookings they made during the period on leads that came in during the period. It's part of their Booked, so it's never higher: the rest of their bookings were on older leads.
Click a name in the leaderboard to see what that person did over the same dates. It's the same view as the calendar's Team tab:
- Their counts of calls, messages, emails, outcomes, stage moves, notes and anything else.
- Their activity by hour.
- Everything they did, newest first. Each entry names the patient it was for and links to their record.
You need permission to see patients to open it. Unknown can't be opened, because it isn't one person.
Revenue on the dashboard
The dashboard counts revenue automatically from the money your practice takes when your payments are in Smileline. That is the case when Smileline is your practice system, or when your connected practice system sends its payments to Smileline. Then:
- Ad return is the money taken in the period from patients who came in as leads from your ads, divided by the period's ad spend. It counts only the ad platforms that recorded spend in the period, so an ad account Smileline can't see never inflates it.
- Goal shows Taken: every payment the practice took this month, less refunds, against your Monthly revenue target.
- Conversion by channel shows each channel's money taken in the period. A payment belongs to the lead the patient last enquired through before paying. Payments from patients who never came in as a lead show as Not from a lead.
Money taken counts payments and insurance payments less refunds, on the day the money was taken. A payment that's later reversed drops out again on the day it's reversed.
If you've only requested your practice system, or it doesn't send payments (the Integrations card says so), the dashboard uses the values on your leads instead: Going ahead counts each lead's agreed value when it went ahead, else its estimate.
Response time on the dashboard
The Avg response time tile shows how long your team takes to reach out to a new lead. The clock starts when the lead arrives and stops the first time a team member works it: a call, text, email or WhatsApp, or an outcome recorded on Leads. It stops whether or not the patient answers, just like Contacted by.
- Automated messages (sequences and campaigns) and the AI don't stop the clock. Only a person does.
- Leads nobody has contacted yet aren't counted. The funnel's Leads we spoke to step shows how many leads are still waiting.
- Only opening hours count. The clock pauses while the practice is closed: nights, closed days and closures. A lead that arrives at 4pm and is called at 10am the next morning counts two hours, not eighteen.
- The opening hours and closures are those of the lead's location, or of the automation location in Settings → Practice when the lead has none. If no opening hours are set, Monday to Friday, 9am to 6pm applies.
- Each lead's own time shows on the same clock beside its status on the patients list and on its journey card. It shows green inside the practice's reply time (5 minutes unless you change it).
The tile covers the leads that came in during the period, and a lower number than the previous period shows in green. In the Team leaderboard, Avg response under each name is the same average for the leads that person contacted first.
Speed to lead tiles
The Speed to lead report has two tiles that are easy to mix up. Both are a share of the leads that came in during the period.
- Leads we tried to contact is the share of leads with at least one try, whether or not anyone got through. A try is an outcome recorded on Leads (a no answer counts), a call from the AI, or anything that got through.
- Leads we couldn't speak to is the share of leads nobody has got through to yet. Getting through means an outcome on Leads saying you reached them, a message a team member sent, a booking, a call from the lead that you answered, or an AI call they picked up.
A lead you rang with no answer is in both tiles. Automated messages (sequences and campaigns) don't count as a try. The report's averages, the Time to first contact chart and the Contacted column all count from the first time someone got through.
Schedule an email digest
Open the report and click the envelope icon (Schedule email) beside its title. The subscription keeps the current report, filters and time grain, and sends a compact digest with a signed-in link back to the live report.
Choose a recipient, timezone and a daily, weekly or monthly schedule. A digest carries the report's totals and its first summary table, never rows that name patients. Team managers can schedule for another member who still has report access (and inventory access, for an inventory report); other report viewers can schedule only for themselves. Send test queues a one-off digest without changing the next scheduled run.
You can pause, resume, edit or delete a subscription from the same dialog. Smileline recalculates wall-clock delivery across daylight-saving changes and can retry a recent delivery failure without sending a burst. It does not send reports that fell due while the practice subscription was stopped. Delivery failures are recorded against the subscription and the most recent error is shown in its dialog; a run of failures never switches the subscription off on its own, so a provider outage cannot silently end a practice's reporting.
Delivery history and Replay
Click Deliveries beside a subscription in the dialog to see every delivery attempt — sent, waiting or failed — newest first. Narrow it by Status and click Load more to continue; nothing is dropped from the history. Each delivery shows the occurrence it was for, its kind, state, generation and error; open Details for the period it covered, the attempt count, the delivery it replays, when it was sent and the email provider's message ID.
A failed delivery, or one still waiting after its retry window closed, shows Replay. Replay queues a new delivery at the next generation that points at the failed one, which stays on record unchanged; the new delivery appears at the top and the deliveries already loaded stay. If Smileline refuses the replay, for example because the delivery was sent meanwhile, the row says so and stays listed. If the history can't be read, it says so with Retry.
The same history is in the API: GET /report-subscriptions/{id}/deliveries
lists it a page at a time by an opaque cursor, and
POST /report-subscriptions/{id}/deliveries/{deliveryId}/replay replays one.
If a recipient leaves the practice, Smileline disables their subscription and clears the recipient before removing their team membership. Past delivery history remains available to managers, but no further digest is queued until a manager selects a current team member and re-enables the subscription.
Ranking guide
See what matters most to show up on Google and in AI answers, what Smileline has already checked for your practice, and how to do the rest.
Calls
Inbound calls on your numbers — answered against missed, ring time, which campaign and keyword the callers came from, who took them, and the missed calls nobody rang back.